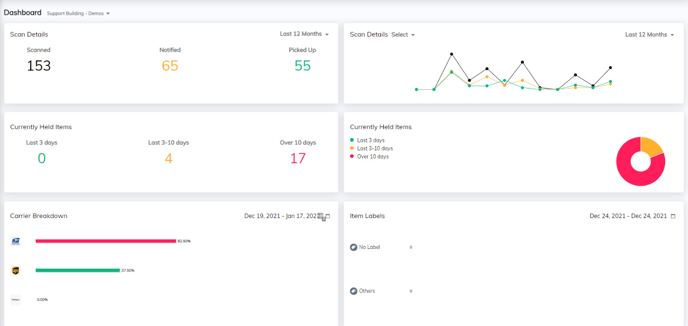
You can view the analytics of overall scanning activity in your building from the dashboard module available on our web portal.
The analytics of the overall scanning activity in your building can be checked by going to the dashboard module of the web portal. It provides a variety of analytics which have been mentioned in detail below.
Scan Details
This section highlights how many items were 'Scanned’, ‘Notified’, or ‘Picked Up’ during a specific time. You can filter these stats by selecting a particular time range i.e., Today, Last 7 Days, Last 4 Weeks, and Last 12 Months by tapping on the arrow icon next to 'Today'.
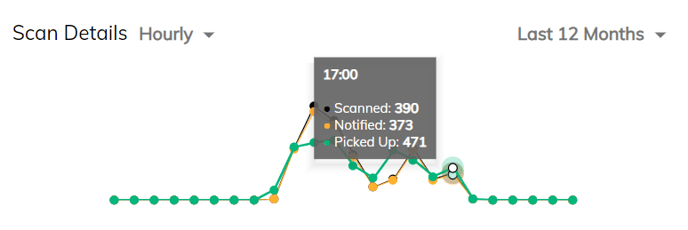
In addition, you can also view the graphical representation of the scan details for the hourly scanning activity. This will help you figure out the busiest hours in your mailroom and allocate your mailroom staff accordingly
Currently Held Items
This section highlights the statuses of items that are currently held in the mailroom i.e., overdue, holding, and scanned items.
Note: Overdue Items (red) have been scanned and notified by the user but haven’t been collected by the recipient for 10 days or longer. Holding items (yellow) have been recently scanned and notified by the user but are yet to be picked up by the recipient.

Carrier Breakdown
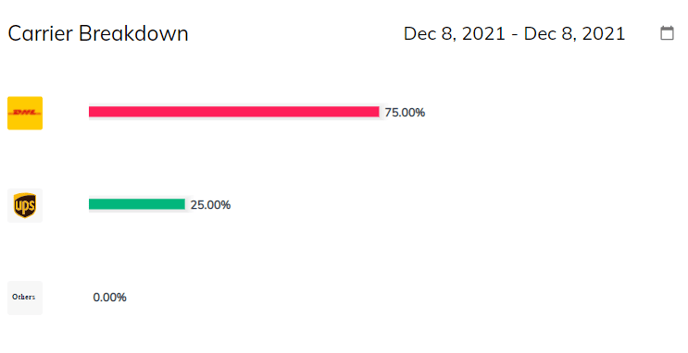
This section allows you to view the count of items coming into your building from different couriers. In addition, it helps you identify which carrier is dropping most packages in your facility.
Item Labels
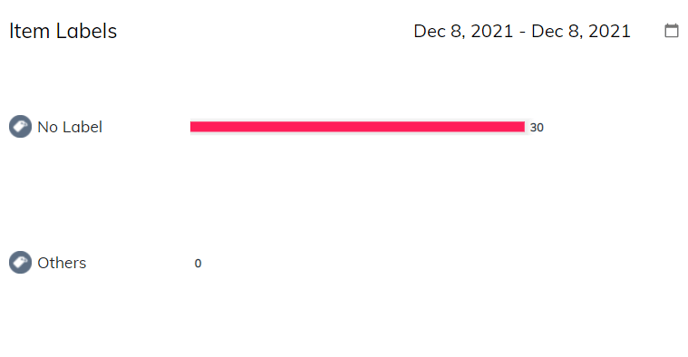
This section provides additional insights regarding the item labels i.e., ‘confidential’ and ‘fragile’ etc. that are mentioned on the package label.
In case of any difficulty, reach out to us at support@packagex.io and we will be glad to assist you
